| HOME |
|
| Software-System-Components | |
| LysiMess | |
| LysiVisu | |
| LysiControl | |
| LysiProtokoll | |
| LysiDBAdmin | |
| Other Services | |
| Projects and Reference | |
| Contact | |
| Imprint | |
LysiVisu - DATA VISUALISATION SOFTWARE
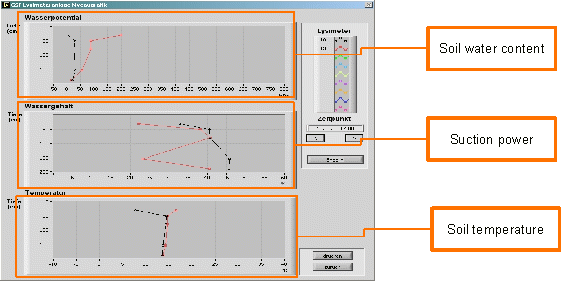
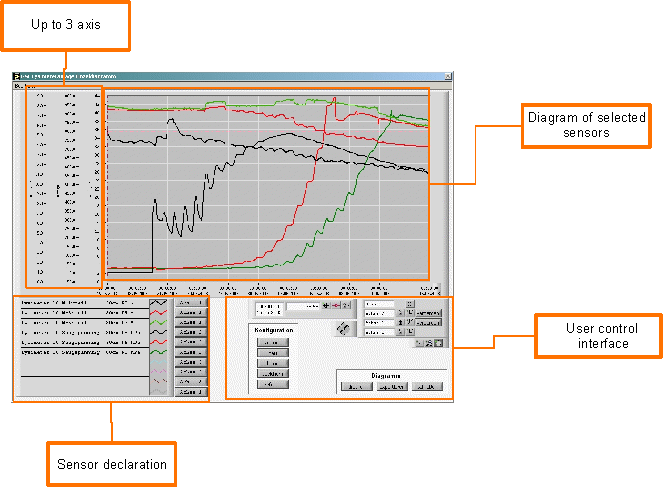
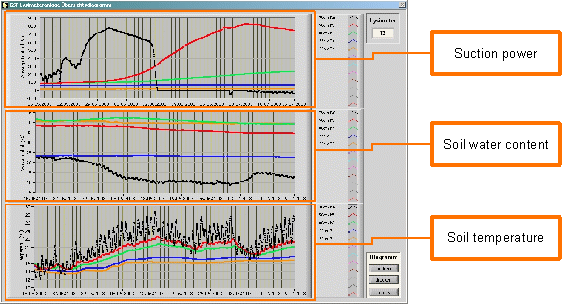
LysiVisu is a visualisation software component which is designed for both scientific data analysis and daily maintenance. It has three main views for different scopes : |
||
|
||
- This way you have ergonomic overview of one lysimeter. |
||
|
||
 - With the level diagram you can analyse up to 10 different lysimeter and their value progression in different depth over a free selected time period. |
||
|
||
 The indivdual view comes with a great of visualisation options: |
||
| - Define your own sensor data groups of all stored data e.g. a dedicated meteorological station - Save and reuse data views of your own sensor and time period selection - Save and reuse defined data views until today for daily analysis and maintenance - Export of visualised data for use in external applications - Visual options like 3 axis, drag, zoom in and zoom out, colour and line selection, . . . - Display of visualised measurement values. And of course LysiVisu adjusts to new facility configuration automatically . |
